To our Partners at HIT Capital,
HIT Capital’s gain in 2017 was 10% in comparison to the S&P 500’s 22% and Hedge Fund Index’s 10%. This gives HIT Capital a 17% compounded annual growth rate since inception and an overall outperformance of the S&P 500 and Hedge Fund Index by 18% and 87% respectively.
The US market performance continued to be strong but speculative over 2017. In our 2016 end of year update, we mentioned the S&P 500’s Shiller PE was at 26 when its historical average was 16. Fast forward one year and the S&P 500 Shiller PE has expanded to 32, twice the price of its historical average. The new tax bill set to go into effect in 2018 will increase corporate earnings by reducing the corporate tax rate from 35% to 21%. Reducing tax liabilities will boost values, but will not do enough to bring domestic equity prices back in line with their historical average.
Five years ago we launched HIT Capital when the Shiller PE was around 22. We focused solely on the Beta Slippage strategy. At that time, the domestic market was 36% cheaper and Beta Slippage was in a better situation to perform exceedingly well. As the domestic market has become more expensive, HIT has diversified by adding Contango, Value, and Momentum strategies to the portfolio. The Momentum and Value strategies are particularly helpful because they can be implemented globally and across various business sectors and sizes. Multiple strategies means flexibility and we can better adjust the portfolio in response to the market. Historically, the more expensive markets have underperformed the less expensive markets*. Here’s a breakdown of HIT Capital’s portfolio and how we are trying to mitigate the risk associated with an expensive domestic market: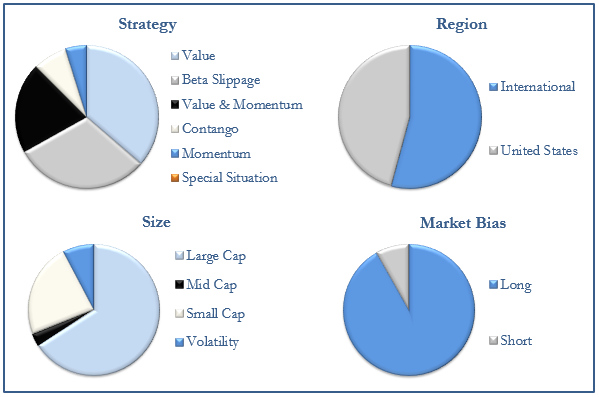
The fund’s international value and momentum allocation has increased over the past year and is now more than 50% of the portfolio. A likely by-product of this shift will be some loss of correlation previously seen with the S&P 500.
For those interested in bet size versus year-over-year outcome, this bubble chart shows how the underlying investments performed over 2017.
Now to report on a call that didn’t go as planned. We previously identified the Oil and Gas sector as a potential source of market outperformance due to the supply glut and corresponding oil price decline. Over the past 6 months global oil demand outpaced supply and oil prices have since recovered, as we predicted. Crude oil passed our $60/bbl target and we sold our corresponding position in Jones Energy. Our investment thesis was working early-on, but Jones did not track the underlying oil price increase in 2017. When we exited the position, it was at a loss. That said, our primary focus remains on optimizing the fund’s long-term strategies.
HIT Investments has been busy moving from Farmington, NM to Houston, Texas and we made it just in time to meet Hurricane Harvey. (You can read our recaps here and here) After our new community began its recovery from the storm, The Texas State Securities board approved our request to move HIT Investments to Texas. If there are any material add-on affects from changing from the New Mexico Securities Division to the Texas State Securities Board, we will let you know.
The annual ADV update and privacy policy notification is still mandated and can be found through the following two links.
M.D. Hall and Co, Inc has already begun our annual fund audit and will be contacting you to confirm any contributions/distributions around the February time frame. Once the audit is complete your personalized K1 tax documents will follow.
Thanks again for your trust and investment. Until next time, all of us at HIT Investments wish you a healthy, safe and prosperous future.
Warm Regards,

Stephen Read
*The Shiller PE is one of 3 fundamental ratios we have seen evidence in forecasting long term future returns (10+ yrs). The other two (Price to Book and Market Capitalization to Gross Domestic Product) have similar low to no real return expectations over the next 10 years for the United States equity market.
This report is intended to assist limited partners in understanding how HIT Capital LLLP (Fund) performed during the period ended December 31, 2017 and reflects the views of the general partner at the time of this writing. These views may change and do not guarantee the future performance of the Fund or the markets. Portfolio composition is subject to change. The current and future holdings of the Fund are subject to investment risk.
Important Information
Hedge fund investing involves risks, including possible loss of principal. An investor should consider the investment objectives, risks, charges and expenses of the Fund carefully before investing. The Offering Documents contain this and are available by contacting Stephen Read @ 309.253.7887 or Stephen.Read@HITInvestments.com. The Offering Documents should be read and understood before investing.
The comparison of the Fund’s performance to a single market index is imperfect because the Fund’s portfolio may contain options and other derivative securities, may include margin trading and other leverage, and is not as diversified as the Standard and Poor’s 500 Index or other indices. Due to the differences between the Fund’s investment strategy and the methodology used to compute most indices, HIT Investments cautions potential investors that no indices are directly comparable to the results of HIT Capital.
S&P 500 data is the S&P 500 Total Return Index (no expenses and re-invests dividends)
S&P 500 data provided by Yahoo Finance
Hedge Fund Index data provided by BarclayHedge